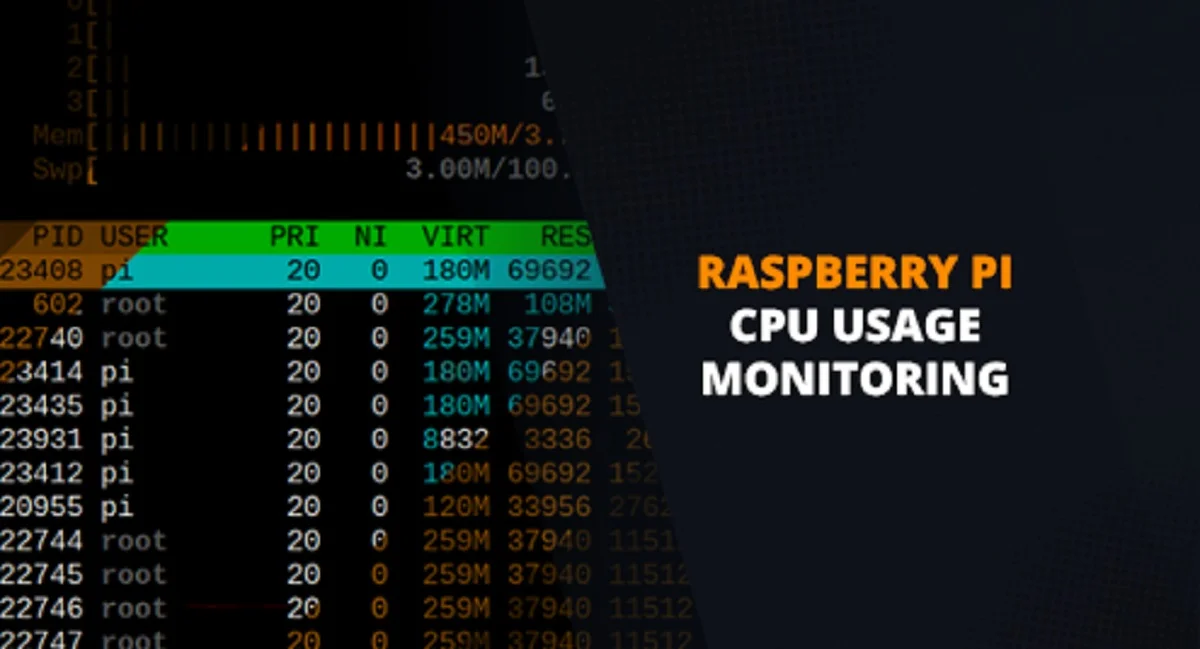
The Importance of CPU Usage Monitoring on Raspberry Pi
Monitoring CPU usage on a Raspberry Pi is essential for maintaining optimal performance and identifying resource-heavy processes. For users ranging from beginners to experts, understanding CPU utilization is key to optimizing the device’s capabilities, especially when running demanding tasks or projects.
Method 1: Utilizing the Command Line for Instant CPU Insights
The command line offers a swift and efficient avenue to monitor CPU usage on Raspberry Pi. Here’s how you can harness this tool:
- Accessing CPU Data with the ‘top’ Command:
- Open a terminal window and enter
top. - This command reveals a live list of processes with their corresponding CPU usage percentages.
- To exit, simply press “q”.
- Open a terminal window and enter
- Snapshot of System Load with the ‘uptime’ Command:
- For a quick check, use
uptime. - It displays the system uptime and average CPU load over 1, 5, and 15 minutes.
- For a quick check, use
The command line is an ideal choice for those comfortable with terminal navigation, providing real-time CPU usage data.
Method 2: Delving Deeper with the ‘top’ Command
The top command is not just for quick glances but also for a more detailed CPU usage analysis:
- After entering
top, you’re presented with a dynamic list of processes, primarily sorted by CPU usage. - This method offers a deeper look into what’s consuming your Raspberry Pi’s resources.
Method 3: Exploring CPU Usage with the ‘htop’ Tool
For a more advanced and visually engaging CPU monitoring experience, the ‘htop’ tool is your go-to option:
- Installing ‘htop’:
- Enter
sudo apt-get install htopin the terminal. - After installation, start the tool with
htop.
- Enter
- Navigating ‘htop’:
- Enjoy a detailed display of processes and their CPU usage.
- ‘htop’ provides a breakdown of usage per core and allows interactive navigation.
Method 4: Leveraging the System Monitor Application
Prefer a graphical approach? The System Monitor application is your solution:
- Find and launch “System Monitor” from your Raspberry Pi’s menu.
- Navigate to the “Resources” tab for a graphical view of CPU usage.
This method is ideal for those who favor a visual representation of their device’s performance.
Method 5: Crafting a Custom Python Script
For those adept in programming, creating a Python script offers tailored CPU monitoring:
- Script Basics:
- Start by importing
psutil. - Use
cpu_usage = psutil.cpu_percent(interval=1)for obtaining CPU usage.
- Start by importing
- Script Customization:
- Tailor the script to your needs, like triggering actions based on CPU usage.
This method provides unparalleled flexibility for integrated monitoring or automation.
In conclusion, monitoring CPU usage on your Raspberry Pi is a critical task that can be accomplished through various methods. From command-line tools like top and uptime to more advanced options like ‘htop’ and custom Python scripts, each method offers unique advantages. The choice of method depends on your comfort level and specific needs. Whether you’re monitoring for performance optimization or troubleshooting, these tools ensure your Raspberry Pi runs efficiently. Happy monitoring!


